


CITY OVERVIEWS
General lesson
In addition to the concrete results, COST Action Sub-Urban is successful in creating a community of practice between the geoscience and the planning communities, involving cities, universities and institutes. To some extent, the project is already improving the conditions for urban subsurface planning, especially where communication, mutual understanding and awareness raising are concerned. For better impact, however, this will have to be extended to decision makers and the general public.
The subsurface is an important constituent of the physical environment of cities. We live on top of it; building and construction have to deal with the structure and properties of the subsurface, and occasionally with the hazards it presents. Cities not only expand outward and upward, but also downward. More and more, subsurface space is used to relieve the increasingly crowded and congested urban surface, especially for networks (metros, tunnels, cables, sewage, drainage), storage (warehouses, cellars, parking lots, thermal energy), and exotic applications such as shelter and protection (nuclear bunkers, bank vaults, underground passageways in cities with harsh climates). The more use we make of subsurface space, the more surface space we free for the one function that cannot do without daylight and fresh air: living.
Its ability to record is a function of the subsurface that is particularly relevant to the urban domain. Just as rocks in general are records of conditions and events in the geological past, the urban subsurface can be seen as a physical record of the history of cities. Buried cultural heritage needs our protection, whether by preventing its degradation in situ, or by careful excavation before building and construction take place. However, it also reflects industrial legacies and their impacts in the form of polluted soils or unstable mine shafts.
From the above, the importance of knowing the ground beneath cities may seem self-evident, but the urban subsurface is in fact still largely ‘out of sight, out of mind’. It does not present a daily concern to city planners and managers, and when it does, there is often trouble. COST Action TU1206 Sub-Urban therefore sets out to explore, promote and improve the use of the urban subsurface. It aims to help identify options for cities to grow and develop more sustainably that are currently overlooked, and to increase the predictability of ground conditions that are now considered unforeseeable. For these purposes, this report offers a review of the state of the art, which describes the interactions between urban and subsurface domains in generic terms, with special reference to the acquisition of subsurface data, their interpretation into useful subsurface models, and the transferability of data and models to planning documents.
Read more in the summary report Out of sight Out of mind?
Keywords
City; urban planning; urban geology; subsurface; A Coruña; Bergen; Dublin; Glasgow; Hamburg; Helsinki; Ljubljana; Nantes; Novi Sad; Odense; Oslo; Rotterdam; Europe.
ingelöv eriksson
WG1 co-Leader
Agency for Planning and Building Services, Oslo city
A CORUÑA
A CORUÑA
A Coruña is one of the main cities of Galicia, in the Northwest of Spain. With 244.388 inhabitants (2007) is the main urban agglomeration in the North of Galicia, and key a point in the Atlantic axis, which runs along the Galician coast into Portuguese lands. It is the central city of an urban agglomeration, comprising the municipalities of Arteixo, Culleredo, Oleiros (first Metropolitan belt), and Cambre, Bergondo, and Sada (in a second belt). A Coruña is a medium size city, developed in a 36,8 km2 surface, even with the annexation of the former municipality of Santa María de Oza, produced in 1912.
The location of La Coruña on a peninsula and an isthmus makes it easy to orientate in it, as always has the sea as a reference. First, we must distinguish the historical centre, made up of the districts of the old town (Ciudad Vieja) and the Pescadería. The first of them, the old town is characterized by narrow and winding streets that were restricted its development by defensive walls existing at the time, whose remains can still be found. The Pescadería was a neighborhood of fishermen, and remained walled until the 19th century. Today it is a centre of business and commerce.
If we go to the peninsula, we find the Monte Alto neighborhood. This neighborhood was occupied in the decade of the 60´s, with buildings that not saved any aesthetic, and generate overcrowded areas, where shortage of green areas and free zones is the general trend. At the edges of the maritime promenade, we find the neighborhoods of Adormideras and As Lagoas, characterized by its curved buildings. Remarkable is the spatial and geographical uniqueness of the municipal area, at the end of a natural peninsula, which multiplies the perimeter of the coastline, in spite of his small area, and gives it a great landscape singularity.
The Spanish cities have experienced in recent decades strong growth processes towards out, simultaneously that its dynamics would become a new metropolitan dimension. A Coruña is not an exception. It has reached a situation in which nearly half of the soil is urban and large part of its industrial growth is orientated towards other municipalities.
The urban and economic growth of A Coruña is generating strong synergies with the bordering municipalities, managing to shape a continuous urban with someone of them. Municipalities as Oleiros, Culleredo, Arteixo or Cambre gain population in every census, due to the displacement of the A Coruña population towards its bordering municipalities.
Population density
Since the beginning of XX Century the population density in Galicia always has surpassed the Spain. This differential is currently located at a value of 14 inhabitants /km2: 93,6 inhabitants /km2 in Galicia and 80 inhabitants /km2in Spain, according to demographic data from the Municipal register of Inhabitants in 2006.
Within Galicia, Pontevedra province exceeds the 200 inhabitants /km2, followed by A Corunna province, with 142 inhabitants /km2 in population density. Behind them, Lugo and Ourense presents figures significantly lower, with 36,2 and 46,6 inhabitants /km2, respectively. There becomes latent so the difference between the inland, with a regressive character and an large dispersion of the population, and the areas which fall within the sphere of influence of the Atlantic axis.
In the metropolitan context of A Coruña, the municipality that presents a higher population density is precisely the capital, with 6.471,3 inhabitants /km2. It is followed, in great distance, by the municipalities of Oleiros, Betanzos, Cambre, Sada, Culleredo, Corcubión and Arteixo, which overcome the 200 inhabitants /km2.
Recent demographic and economic studies demonstrate, without any doubts, the strength of the new metropolitan situation: the economic processes, the dynamics of population, the movement of labour and services have taken another spatial area.
This situation is mainly expressed in:
Flows in the location of the residence: there is detected the output of 1 % of the population who looks for residence outside the central municipality, either by the cost and/or because the type of residential offer, often times in search of major privacy, that seems tonot find in A Coruña.
Also in the "forced" movements of work of different: 58% of people who use the city on a daily basis has the residence outside the municipality.
Demand for services, personal or for educational or scattering purposes, which largely still concentrated in the central municipality: University, Hospitals, the cultural, sports equipments, etc.
As consequence of these new phenomena, the mobility between the metropolitan municipalities increases continuously.
This scenario is typical of European cities whose size corresponds to A Coruña and presents a relatively stable dynamics.
BASEL
BASEL

Basel City. Photo Jannis Epting.
The Basel region, which borders both Germany and France, is one of the most dynamic economic regions in Switzerland and acts as a vital regional as well as interregional traffic junction. Moreover, Basel has a variety of natural environments, as well as highly vulnerable groundwater systems in river valleys and adjacent karstified areas. Environmental changes include the development of subsurface infrastructure (e.g. tunnel highways) and urban subsurface structures, which in general, permanently impact groundwater flow and thermal regimes. The existence of evaporites and mixtures of marl-bearing evaporites in the Triassic formations as well as the fact that Basel is located in the seismologically most active area of central Europe comes along with the potential occurrence of geohazards. Some of these hazards are natural; others are triggered by human activities.
In the last ten years these sites have been equipped with extensive groundwater monitoring systems. At the same time high-resolution geological and hydrogeological models were set up and calibrated with long-term datasets that allow comprehensive investigations of subsurface resources, groundwater flow regimes and the description of relevant boundary fluxes. The models have predictive capabilities and have already been successfully used for scenario development. These already existing tools provide substantial contributions to the understanding of hydrogeological processes and are the basis for hypothesis testing.
The Basel area includes a series of important local and regional scale water supplies, several floodplains in densely populated river valleys, as the floodplains of the Birs River (12km2) and the Wiese River (6km2) as well as the heavily industrialized area in the floodplain of the Rhine River (64km2). All sites represent important groundwater production areas in park-like natural recreation environments, surrounded by urban agglomeration, industry, contaminated sites and traffic. Drinking water supply competes with other interests or demands such as river training, flood control, recreation as well as urbanization and changes of land-use. The existence of evaporites and mixtures of marl-bearing evaporites in the Triassic formations as well as the fact that Basel is located in the seismologically most active area of central Europe comes along with the potential occurrence of geohazards. Some of these hazards are natural; others are triggered by human activities.
In the last ten years these sites have been equipped with extensive groundwater monitoring systems. At the same time high-resolution geological and hydrogeological models were set up and calibrated with long-term datasets that allow comprehensive investigations of subsurface resources, groundwater flow regimes and the description of relevant boundary fluxes. The models have predictive capabilities and have already been successfully used for scenario development. These already existing tools provide substantial contributions to the understanding of hydrogeological processes and are the basis for hypothesis testing.
Read the Basel City Case report TU1206 WG1-017
City facts:
- Population: ca. 175.000
- Size: 23 square km
- Key city issues: e.g. Flooding, Heat Pumps, Contaminated land etc
BERGEN
BERGEN
Bergen is the second largest city in Norway next to Oslo, the capital. Bergen is located on the western coast of Norway and with its appurtenant municipality is the largest city in Hordaland county. Bergen was founded around A.D. 1070. The town gradually developed around Vågen (“the bay”), a central harbour for trade along the coast, and was one of Northern Europe’s most important ports, including one of the Hanseatic League’s for most important towns. The Vågen area gradually expanded up to 140 m seawards by filling a range of materials such as wood and household rubbish into timber “boxes” in the seawater at the quay front. Due to its outstanding testimony to past traditions, Bryggen became designated as a World Heritage Site in 1979.
Read more about Bergen City in case study report TU1206-WG1-003
Description of City and Projects
A large part of the settlement in the city centre, the Vågsbunnen area, is situated on top of several meters of cultural deposits that are vulnerable for degradation and subsidence. In connection with the upgrading of road and rehabilitation of parts of the district Vågsbunnen, significant subsidence connected to artificially low groundwater levels have been observed. The municipality has increased awareness related to measures that may alter the groundwater level and the impact this can have in terms of damage to cultural heritage above and below ground, as well as subsidence that could further damage buildings, structures, cables, roads and pavements. A municipal pilot project has been initiated to map existing groundwater pumps. This has led to restrictions on the right to implement measures in the ground that can alter the groundwater level.
City Challenges
The city needs a comprehensive understanding of the subsurface to ensure a more sustainable and cost-effective management of urban spaces, including tools, procedures and methods to better integrate urban geological knowledge in land management.
Project Bryggen (2000-2014) is a long-term initiative to restore and safeguard the endangered World Heritage Site Bryggen in Bergen. The project presents a collaboration between the Directorate for Cultural Heritage, Hordaland county, theBergen municipality as well as local landowners, and the Geological Survey of Norway. The measure is financed with public funding.
The Bryggen is only a small part of Vågsbunnen, and is regarded as a crucial preliminary project for the larger follow-up project that is initiated in 2014, and will include the largest portion of the medieval city center.
Key city date
Surface area: 465,56 km²
Number of inhabitants/population: 272 600 (5th May 2014)
The increase in population is 11.0% per 10 years » 1.1%/year
The population density in Bergen is 566.0 inhabitants per km²
Total number of housing: 127 123 registered buildings
The number of registered (personal) vehicles is 111.172 (2008)
Network infrastructure: busses, train, light rail
DUBLIN
DUBLIN
Dublin is Ireland’s capital and largest city with a population of 527,612 (2011) and it lies on the East coast of the Ireland. The Dublin metropolitan area is Ireland’s financial and administrative centre. Dublin is the hub of Ireland’s transportation networks and a key gateway for international trade via air and sea. The Republic of Ireland has a total population of c. 4,588,000 and of that population c. 1,273,000 live in Co. Dublin making it the most densely populated part of the country.
Read more about Dublin City in case study report TU1206-WG1-004
The Dublin Region comprises the administrative areas of Dublin City Council (pop. 528,000), Fingal County Council (pop. 274,000) South Dublin County Council (pop. 265,000), and Dun Laoghaire-Rathdown County Council (pop. 206,000). With the exception of Dublin City, each of the county administrative areas has a mix of rural and urban zones.
The most urbanised and densely populated part of the City is administered by Dublin City Council. This central part of the city also reflects port and industrial land-use, brownfield regeneration and major infrastructure hubs and networks. The councils remit includes environment, recreation and sport, strategic planning and economic development, roads and transportation, housing and community, planning and development and culture and amenity. The administrative boundary corresponds to the Dublin City Council boundary and this is the area discussed in the City Studies report.
Since the 90s, the landscape of Dublin has change dramatically due to the rapid economic expansion during the Celtic Tiger period.
City Description
County Dublin is located on Ireland’s eastern coastal margin and occupies an area of 920 km² (c. 1.3% of the total area of the Republic of Ireland). Dublin is situated at the mouth of the River Liffey. It is bordered by a low mountain range to the south and surrounded by flat farmland to the north and west. The Liffey divides the city in two between the Northside and the Southside.
Social
- Dublin is the biggest city in Ireland with a population of 527,612 (CSO, 2011). 1,273,000 live in Co. Dublin making it the most densely populated part of the country.
- The number of households in Dublin City has decreased dramatically due to the recession. Demographic change implies that between 2011 and 2021, 180,000 additional housing units would be required for Ireland. From those, over 60% of these are required in Dublin.
- 2011 Census shows a decline in general health with age. People who live in the suburbs have better overall health compared with the people who live in the City Centre.
- Dublin City Centre has population age average of 36.6-37.3 making it slighter older than the surrounding counties, but slightly younger that the west of the country.
Environment, land use and infrastructure
The total number of dwellings in the City of Dublin is 207847 (CSO, 2011) from those:
- 10837 are detached houses
- 47998 are semidetached houses
- 74179 are terraced houses
- 54639 are flats or apartments in a purpose built block
- 10858 are flats or apartments in a converted house or commercial building
- 3697 are bedsits
- 5639 are not stated
- According to the 2011 Census, 55% of commuters living in Dublin City and suburbs drove to work. 62693 people walk to work. 21% used the public transport to work and 5.9% cycled to work.
- Dublin City Council is responsible for approximately 1400 hectares of public open space dispersed throughout the city in the form of public parks and other spaces associated mainly with residential developments.
- Climate change predictions in Dublin City indicate an increase in the risk of flooding. This suggests that coastal defence systems may have to be implemented.
Economy
- Economic activity in the Dublin region accounts for 47 % of national GDP.
- 34% of the State’s workforce lived in the Greater Dublin area in 2011.
- Some 84,000 people were employed in the Dublin Region in 2013, representing over 40% of the total number of people employed in the State.
- In Dublin City, the proportion of persons over 15 with a higher level of education is 35%.
Glasgow, Scotland's largest city, is built along the upper Clyde estuary and lower River Clyde. In the heart of the city are the Clyde Gateway and Clyde Waterfront areas - the national urban regeneration priority for Scotland over the next 25 years.
This regeneration is intended to stimulate economic growth, drive smaller community regeneration projects, and tackle concentrated deprivation resulting from industrial decline.
To underpin this regeneration we are developing integrated and attributed dynamic shallow-earth 3D models in partnership with Glasgow City Council and other organisations.
Working together, Glasgow City Council and the British Geological Survey are helpingplanners, developers and environmental managers to see the city from beneath through the exchange of 3D subsurface information via the ASK Network (Accessing Subsurface Knowledge).
Read more about Glasgow City in case study report TU1206-WG1-005
The City and its needs
Glasgow, a city of nearly 600,000 people on the River Clyde grew through industrialisation, mining and maritime trade. Though these activites have declined, Glasgow remains Scotland’s main economic centre. The modern City needs to future grow, attract investment, promote health, wellbeing and education, and maintain the City’s built and natural environment in the face of changing climate. These goals are interwoven with the legacy of past heavy industry and mining that have left their mark on Glasgow’s ground. Problems of derelict land, contamination and subsidence are balanced by opportunities for energy generation from surface deposits and deeper mine workings.
Geology and subsurface information
In 2009, the British Geological Survey (BGS) initiated the Clyde Urban Super Project (CUSP), a multi-disciplinary project to develop subsurface information for Glasgow to support regeneration and development, improve understanding of groundwater systems, and assess soil quality in the City and surrounding area. Partnership between BGS and Glasgow City Council (GCC) led to the development of the ASK Network (Accessing Subsurface Knowledge), a partnership of public and private sector organisations focused around the exchange of subsurface data and knowledge. Through the ASK Network, BGS and GCC are pioneering new initiatives for the exchange of 3D geological subsurface models, and site investigation and borehole data between the public and private sectors. The proposed City Development Plan for Glasgow recognises the importance of the subsurface environment in the development of spatial strategy, policies and proposals for the future use of land and infrastructure in Glasgow, reflecting the growing awareness of the importance of subsurface knowledge for the City.
City facts
Glasgow is located in the west of the Central Belt, the most populated area of the Scotland, and approximately 40 miles west of Edinburgh, the capital city. It covers an area of 176 square kilometres and has the highest population density of any Scottish city (3395 people per square kilometre). The Greater Glasgow Area, which includes surrounding metropolitan areas, is approximately 370 square kilometres. Approximately 2.5 million people, half of Scotland’s population, live within an hour’s drive of Glasgow.
Project Partners
Key partners: Glasgow City Council, British Geological Survey.
ASK Network partners: Arup, Atkins, B.A Hydro Solutions Ltd, CH2M Hill (Halcrow), Grontmij UK, Jacobs, Scottish Coal Ltd, URS Infrastructure & Environment UK Ltd, Scottish Power, Scottish Water, Transport Scotland, Glasgow Caledonian University, University of the West of Scotland, Glasgow and the Clyde Valley Strategic Development Planning Authority (East Dunbartonshire Council, East Renfrewshire Council, Inverclyde Council, Renfrewshire Council, South Lanarkshire Council, West Dunbartonshire Council), North Lanarkshire Council.
Gothenburg (Göteborg)
Gothenburg (Göteborg)
Gothenburg is a port city in Sweden with a strategic location between Olso and Copenhagen. It has a population of around 533.000 and is Sweden´s second largest city next to Stockholm, the capital. The city lies by the sea along the Göta Älv River and is home to Scandinavia’s largest port. Gothneburg use the Göta Älv River as the drinking water source, about two cubic meters per second is used for drinking water production.
There’s plenty going on in Gothenburg right now. The city is growing strongly and is preparing to make space for 150.000 more residents by the year 2035. As the city grows, it is also evolving. New houses are being built, and new residential areas and city districts are emerging on land previously used for industrial purposes. New roads, bridges, cycle paths and expanded public transport will make it easier to get around in the city, both for private individuals and the business sector. The planned investments in public transport, roads and railways as part of the West Sweden Agreement are the largest in the Gothenburg region since the 1960s. The West Seden Agreement includs a new railway tunnel underneath the central parts of Gothenburg, with three stations at various places at the city´s central parts.
Gothenburg is growing, but the aim is to shorten distances. The city need to grow and develop in a sustainable way, for example by growing within the already built city and around the strategical nodes where there is good public transport, good service and where many of the city´s residents work and live. Gothenburg has a very large area, approximately 4 km2, of undeveloped land in its city center, located close to the Göta Älv River. The city will be connected across the Göta Älv River, with a central city environments on both sides. The city will be more compact with new homes, workplaces and meeting-places.
The underground space is today used for foundations of buildings, wastewater tunnels, transport tunnels and extractions of heat. The city deals with geological challenges such as deep horizons of clay, at some places quick clays. Additionally large areas in the city centre closest to Göta River have, during centuries, been filled up with artifical fillingmaterial of various origin and thickness. The hydrological situations in Gothenburg is explained with two groundwater systems, an upper aquifer and a lower aquifer, isolated from one another because of the clay in between. The upper aquifer is located in the artificial fillingmaterial. The lower aquifer, mostly confined, is located in the glacial till deposit, underneath the clay. Gothenburg also deals with historical groundwater level lowering which has contributed to subsidence and damage to buildings and infrastructure.
The city of Gothneburg monitors the groundwater level, a network established in the early seventies. The frequency and number of monitoring wells have varied during the years. Today there is 140 minitoring points and the measuring frequency is six times a year. The network was established in order to monitor levels in areas where groundwater are affected by drainage due to underground facilities. Today the aim of the network is also to get a general knowledge of the groundwater level in the municipuality.
History
Gothenburg first started being built in 1619 on the initiative of King Gustaf II Adolf, and it received its city charter in 1621. The city was built and organized by the Dutch and Germans, and during the 18th century it developed into a prospering shipping and trading city. During the 19th centuries much of Gothenburg´s development was characterized by functional separations and urban sprawl as during the period a large share of the city center was devoted to a booming ship building industry. As a result of the collapse of the ship building industry in the 1970s Gothenburg has a very large area approximately 4km2, of undeveloped land in its city centre. Today Göta Älv River is used as source for drinking water production but before the 1960s the drinking water was primarly taken from smaller groundwater sources i.e. spings.
City facts
- Founded: 1621
- Size: 450 km2
- Population: 533.000
- Administration: The city of Gothenburg is an organization comprised of administrations and companies.
Underground use
- Foundations of buildings
- Road tunnels
- Railway tunnels
- Water supply tunnels, waste water tunnels
- Stormwater drainage system
- Storage
- Pipes, cables
- Energy wells for heating and cooling
Underground challenges
- Subsidence
- Deep clay horizons
- Quick clay
- Groundwater changes
- No strategical plan for how underground space will be used/developed
HAMBURG
HAMBURG
Hamburg is the second largest city in Germany next to Berlin. It is also one of the 16 states of the German federation. In this sense, Hamburg is a city as well as a state. Hamburg is located in the northern German lowlands in the lower reaches of the Elbe River, about 100 km from the mouth of the river into the North Sea.
Read more about Hamburg City in case study report TU1206-WG1-006
The city and its needs
Hamburg and its surrounding metropolitan region is a dynamically developing region with a growing population and increasing trade and industry, in particular the port industry. Therefore, precautionary measures must be taken to protect the environment on the one hand and to repair existing damage to the environment from the past on the other hand. It is essential to create and maintain a comprehensive database on regional geological and water resource information for various aspects of land use in urban areas.
The landscape of Hamburg is dominated by the current division of the river Elbe with its low-lying marsh areas and adjacent Geest areas. The broad glacial valley of the Elbe separates the Geest area of arburg Hills in the south from moraine Geest area in the north. Hamburg and its surrounding areas are covered with Quaternary sediments (sand, silt, clay, till). Today’s topography had been formed during three glaciations, respectively the Elsterian, the Saalian and the Weichselian.
Geology and surface information
The Geological Survey as a part of the Ministry of Urban Development and the Environment (BSU) receives geological data from official boreholes, private boreholes (e.g. ground source heat boreholes, private water supply boreholes) and site investigation work associated with urban regeneration and development. Once validated, borehole data are stored within the Geological Survey borehole database and becomes instantly available within other live-linked data portals internally and externally via the BSU and internet website (http://www.hamburg.de/bohrdaten-geologie).
City facts
- With 755,3 km², Hamburg is the second largest city in Germany with 1.814.597 inhabitants (2012). The size of the port area is 74,4 km². Hamburg is also economically and culturally the centre of Northern Germany. 4,3 million people live in the metropolitan region of Hamburg – Figure 1.
- The population density in Hamburg is 2402 Inhabitants per km². The total number of housing is 1.002 million (2012). The number of registered vehicles is 850.335.
- The length of the road network is 4400 km (thereof are 83 km motorway). Hamburg has 2500 bridges, more than Venice and Amsterdam combined. The route length of the metro and tram is 873 km (281 stops). 13.7 million passengers are carried per year over the Hamburg airport. The Port of Hamburg is the second largest container port in Europe, with a turnover of goods of about 131 million tons.
Project Partners
Urban planning and management takes place in the Ministry of Urban Development and Environment (BSU). The ministry is comprised of several offices with responsibility for transport, spatial planning, urban renewal, sustainability, resource protection and waste management. The Geological Survey, the COST principle partner at BSU, as well as the Water Department are parts of the office for Environmental Protection. In the field of geology and hydrogeology there is a close collaboration between the Geological Survey and the Water Department. In addition, a good collaboration exists with the state-owned public water supply company Hamburg Wasser.
HELSINKI
HELSINKI
Helsinki is the Capital of Finland and the centre of the Helsinki Region. The Helsinki Metropolitan Area consists of the cities of Helsinki capital region and ten surrounding municipalities. The Metropolitan Area has a high concentration of employment, approximately 750,000 jobs. The Helsinki metropolitan area is the world's northernmost urban area among those with a population of over one million people, and the city is the northernmost capital of an EU member state. The Metropolitan Area covers 3,697 square kilometers.
Read more about Helsinki City in case study report TU1206-WG1-007
Much of Helsinki outside the inner city area consists of postwar suburbs separated from each other by patches of forest. Being called the "Daughter of the Baltic", Helsinki is located on the tip of a peninsula and 315 islands. Despite the intensity of land use, the region also has large recreational areas and green spaces.
City facts
- The Helsinki Metropolitan Area contains a total population of approximately 1.4 million, about a fourth of the total population of Finland. Population density in certain parts of Helsinki's inner city area is very high, reaching 16,494 inhabitants per square kilometer, but as a whole Helsinki's population density is 3,050 per square kilometer.
- Helsinki has some 390 cars per 1000 inhabitants. Public transportation is managed under Helsinki Region Transport, the metropolitan area transportation authority. The diverse public transport system consists of trams, commuter rail, the subway, bus lines, two ferry lines and on-demand minibuses The Helsinki Metro is the world's northernmost subway. Air traffic is handled primarily from the international Helsinki Airport, located approximately 19 kilometers north of Helsinki's downtown area.
How the subsurface is used
Helsinki Region, is located in southern Finland on the Fennoscandian shield area. The old Precambrian bedrock is well suited for rock construction because it is hard and located near the ground surface. Usually Quaternary deposits in southern Finland consist of a thin till cover on the bedrock surface. In typical landscape the hills with bedrock outcrops alternate with valleys filled with clay sediments.
The City of Helsinki has more than 200 km of technical maintenance tunnels, 60 km of which are utility tunnels used by a number of operators. The raw water for the Helsinki region comes via a rock tunnel measuring more than 100 km. Wastewater treatment is carried out centrally at an underground wastewater treatment plant. Approximately 9 million cubic meters, consisting of about 400 separate facilities or tunnels, have been built under the city.
The Helsinki Underground Master Plan controls the locations, space allocations and mutual compatibilities of the newest, largest and most important underground rock caves, facilities and traffic tunnels. 40 new areas and 100 new space allocations are reserved as rock resources for future rock construction.
Energy wells of ground-source heating and cooling are becoming more and more common. Large energy fields for large targets such as shopping centers, office buildings, hotels, and public buildings have also been brought in use. The underground city planning has to pay attention to possible conflicts between different ways to use the bedrock recourses.
Project Partners
Key partners: City of Helsinki, Geological Survey of Finland
LISBON
LISBON

Parque Eduardo VII in Lisbon, Portugal
Lisbon, Western Europe’s oldest city is the capital of Portugal, the major touristic and economic center and has a very densely occupation. However if we analyze its history we see that the ancient occupation of the Lisbon territory was limited to a central core, benefiting from the privileged and strategic position along Tagus River as well as the rugged morphology that has provided natural conditions for the city defense over the centuries.
Many of the city’s buildings are centuries old, and infrastructure is likewise aging and though the city has strong technical expertise and political will to undertake upgrades, it also faces financial constraints from the global economic crisis.
The lack of space led to the expansion of the city to the suburbs as well as to the occupation of less favorable terrains, leading to cost increases.
The solution was the construction in the consolidated city, in height and depth, namely to promote better conditions to inhabitants (basements, underground parking and subway tunnels). However this implies detailed knowledge about subsurface characteristics, which was gathered through survey campaigns. Using this information Lisbon Municipality has been developing a geotechnical database to generate a 3D geological/geotechnical model, aiming cost reduction and new projects optimization.
Read more about Lisbon City in case study report TU1206-WG1-015
Urban improvement projects are being developed to ensure residents have ongoing access to services, and also to:
- Reduce the risk from natural hazards, such as seismic activity which could cripple current structures and networks;
- Reduce the risk from flooding that is also a concern in Lisbon territory, causing regularly, several damages;
- Promote conditions to a sustainable planning and urban management with a mitigation perspective;
- Prepare the city for other threats, especially storms and more severe events brought on by climate changes;
LJUBLJANA
LJUBLJANA
Ljubljana is the capital and largest city of Slovenia. It has a central geographic location within Slovenia. Thanks to its natural features and well-considered urban planning, Ljubljana has a distinctly green identity. The Municipal spatial plan shows that green areas make up nearly three quarters of the entire territory of the City of Ljubljana. As part of the comprehensive vision of the development of the city, which is based on the concentration of existing settlement structures, we emphasise internal development, the concentration of settlement along the main city access routes and the regeneration of degraded areas.
The high proportion of open areas is linked primarily to the hilly, marshy and aquatic natural hinterland of the city, an area that was historically less attractive for construction and urban development. Almost 81% of all green areas lie in the city hinterland (contiguous aquatic, forest and agricultural areas) which extend right into the historical city centre via green wedges and riparian corridors.
Read more about Ljubljana City in case study report TU1206-WG1-008
City facts
- Municipality of Ljubljana covers a total area of 275 square kilometres.
- Ljubljana has 282.994 inhabitants (2012).
- The population density in Ljubljana is 1029,1 inhabitants per square kilometre (2012).
- Total number of housing: 119.687 (2008).
- The number of registered vehicles is 145.810 (2012).
- The length of the road network in Ljubljana is 1152,5 km (54,7 km highways) (2011). The route length of the public bus transport network is 357 km and it has 211 buses. 39.437.000 passengers are carried per year by buses, 1.198.911 over the Ljubljana airport and 3.268.039 by train (2012).
NANTES
NANTES
Situated on the Loire River, close to the Atlantic coast, Nantes is a green wonder of western France with a temperate and oceanic climate. It is France’s sixth largest city The conurbation (Nantes Métropole) comprises 600,000 inhabitants, a number which should reach the 700,000 mark by 2030. The city of Nantes is the capital city of the Pays de la Loire Region, and the Préfecture of the Loire-Atlantique Department. In 2004, Time Magazine named Nantes ‘the most liveable city in Europe’ and in 2013 it held the title of European Green Capital. The Loire River (the longest river in France) played a key role in the city's history and development. In the past, the economy was driven by the city's shipyards and maritime industry. Today, the city's industry and economy have undergone profound, sometimes difficult transformations that have provided an opportunity to redevelop large urban areas, while protecting the fragile eco-systems of the Loire estuary.
Embracing the legacy of the past and adapting it to the requirements of the future is also one of Nantes trademarks. Former industrial sites have been rehabilitated and turned into residential areas based on a sustainable city philosophy centred on building low-energy housing with green spaces and leisure facilities to house the growing population. On the Île de Nantes, urban territory located between two Loire river “arms”, a major sustainable urban planning project is currently underway. This "eco-district" will comprise housing, gardens, leisure facilities, shops and workshops. The Île de Nantes reflects Nantes' innovative and creative take on sustainable urban development. The scheme draws on cutting-edge approaches in terms of construction, public transport, recycling and renewable-energy technologies.
Nantes Métropole’s Climate Plan provides a means of combating global warming. The development of low-energy transport and buildings is an essential component of Nantes' commitment. Natural and agricultural areas account for 60% of the Nantes conurbation, which also boasts 250 kilometres of rivers and streams. The city wants to preserve this living environment and promote balanced and sustainable development across the region. Controlled urban growth and the preservation of natural spaces are strategic objectives. Simultaneously and due to the inhabitants future projections, Nantes has to develop its housing offer. This urban development is constrained because urban sprawl has to be limited.
Urban planning and management
The urban planning is controlled by several guidelines. Nantes Métropole’s Climate Plan provides a means of combating global warming. The development of low-energy transport and buildings is an essential component of Nantes' commitment, along with a preservation of the living environment of the conurbation, characterised by a proportion of 60% of natural and agricultural areas and 250 kilometres of rivers and streams. The city development is additionally highly related to the urban soil management and makes it necessary to develop new research actions. Four case studies point out the need for
subsurface characterisation (top layer, subsoils) and the relationship between soil pollution and hydrology/geology : management of metallic soil pollution in urban allotment gardens, impact of sustainable urban rainwater management, environmental impact of a municipal waste landfill site, excavated materials management according to geochemical properties. The overall research perspectives of this urban soil in Nantes are the development of novel field characterization approaches to improve the cost and time consuming phase of decontaminating soils.
Since 1 January 2001, Nantes Métropole has been acting in the interests of 590,000 inhabitants of 24 municipalities in the Nantes urban area. In creating Nantes Métropole, these 24 municipalities (See Figure 1) joined forces for greater solidarity between their residents and for development that would respect natural balances. The authorities of the institution Nantes Métropole encompass: urban planning, transportation, environment and energy, water and sewerage, sanitation, waste, street network, public spaces, housing, economic development, higher education and research, employment, Europe and international attractiveness. The City of Nantes is the biggest city of Nantes Métropole and it has specific complementary authorities such as public green spaces management.
Read the City case study of Nantes in report TU1206-WG1-009
Novi Sad
Novi Sad
The Novi Sad territory has been inhabited by humans since the Stone Age (about 4500 BC). A settlement was located on the right bank of the river Danube in the territory of present-day Petrovaradin. In antiquity, the region was inhabited by Illyrian, Thracian and Celtic tribes, especially by the Scordisci. Celts were present in the area already in the 4th century BC and founded the first fortress on the right bank of the Danube. Later, in the 1st century BC, the region was conquered by the Romans. During Roman rule, a larger fortress was built in the 1st century (Cusum) and was included in the Roman province of Pannonia.
In the 5th century, Cusum was devastated by the invasion of the Huns. By the end of the 5th century, Byzantines had reconstructed the town and called it by the names Petrikon or Petrikov, after St. Peter. In the Middle Ages, the area was subsequently controlled by the Ostrogoths, Gepids, Avars, Franks, Great Moravia, Bulgaria, again by Byzantines, and finally by the Hungarians. It was included into the medieval Kingdom of Hungary between the 11th and 12th century. Hungarians then began to settle in the area, which was previously populated mostly by Slavs, and the place was mentioned for the first time under the Hungarian variant Peturwarad or Pétervárad (Serbian: Petrovaradin), which derived from the Byzantine variant, in documents from 1237. In the same year, the existence of several other settlements were mentioned to exist in the territory of modern urban area of Novi Sad.
Read more about Novi Sad City in case study report TU1206-WG1-010
ODENSE
ODENSE
The City of Odense is under big pressure – from above: because annual mean precipitation has gone up around 100 mm since measurements started 140 years ago. Extreme rains are occurring more often and they are becoming more intense. There is also pressure from surface water: because of flooding due to extreme runoff in the rivers through the city or flooding from the Odense Fjord. Sometimes both occur at the same time. Thirdly, there is pressure from the subsurface: due to a rise in groundwater level caused by increased recharge, diminishing needs for potable water / lesser water abstraction and the sealing of previous leaky sewers which hereby stop acting as drains.
Read more about Odense City in case study report TU1206-WG1-011
During the last 100 years the area of the city has grown greatly. The water supply was primarily based on local groundwater abstraction sites. Today, it is still based on groundwater, but most of the groundwater abstractions within the urbanized areas have been stopped and the total amount of abstraction of groundwater has been reduced by 50%. Furthermore the majority of our potable water are being abstracted in the surrounding municipalities The effect of these changes has meant that the groundwater level within the city limits has risen dramatically over the past 25 years. In some areas the water table has risen 12 meters. Today, the water level in some areas, are close to what the water level used to be at the turn of the last century (early 1900’s).
The areas that are drained and urbanized are becoming increasingly waterlogged again. This is of great concern for the inhabitants and constitutes a major conflict of interest. The development in urbanization also causes other challenges. The natural seepage of rain into the ground is drastically reduced due to the increase in total area of impermeable surfaces.
Historically, sewage pipes were established as common sewage systems for both rain run-off and raw sewage. Expanding sewage pipe systems to accommodate future heavy rains/climate change is very expensive and sometimes an almost impossible task, but we try. Within the city limit we have used more than 1 billion Euro establishing large diameter sewage pipes for delaying or storing storm water during extreme rains, in order to meet the EU-legislation by hindering/decreasing the amount of sewage water that though “overruns” are led untreated into the Odense Å and Odense Fjord (Å means river and Fjord means Inlet).
Instead of building larger and bigger storage pipes/pools there is a growing interest in securing local infiltration. The need for artificially/naturally enhanced infiltration of rainwater in urban areas is growing. This, again, - is putting further strain on the water level and saturation beneath the city. New large scale suburban infrastructure projects like tunnels and underground parking facilities also puts further strain on the groundwater saturation challenge and may alter the nature of groundwater flow patterns etc.
In order to meet the above mentioned growing demands, the Municipality of Odense together with VCS Denmark (one of the biggest water/waste water companies in Denmark), GEUS (The Geological Survey of Denmark and Greenland) and The Region of Southern Denmark have started building a detailed 3D geological and hydrogeological model. A model to study the groundwater resources, the climate change impact on the water cycle and also covering subjects of archaeological and historical interests.
City facts
Denmark is a small country that covers 43.100 km2 – less than 1/10th of Sweden. Denmark consists of the peninsula of Jylland (Jutland), and an archipelago of 406 islands of which 78 are inhabited. The coastline stretches more than 7300 km in total length. The land is mainly used for agriculture (67%) and forests (12%) and semi-natural areas (11%), also urban areas and infrastructure installations (10%).
The Kingdom of Denmark also includes the Faeroe Island and Greenland. Denmark has a population of 5.6 million inhabitants and the population density is 130 persons per km2. 85% of the population lives in cities and villages with more than 200 inhabitants and 15% live in the countryside and smaller villages. One third of the population lives in Greater Copenhagen.
The Municipality of Odense only covers an area of 305 km2. This place it in the center part of the 98 Danish municipalities –The municipality of Copenhagen – the Capital of Denmark – only covers 88 km2, which is roughly the same area as the City of Odense.
The City of Odense is one of the oldest in Denmark, dating back to the Vikings and their ring fort “Nonnebakken” south of the Odense Å. Archaeological excavations have uncovered pavements, buildings and crafts dating back to the first millennium and the first time Odense is mentioned in a written reference is in year 988. The oldest parts of St. Alban’s Priory and The Cathedral for Canute the Saint are dating back to the 11th century. During the 12th century the building of another church, several monasteries and nunneries and a moat testifies strong urban growth.
OSLO
OSLO
Oslo is the capital of Norway. A small town by global standards, but still a rapidly growing city. The population of Oslo is the fastest growing in Europe, a tendency giving both challenges and opportunities. The city will require large investments in communication systems, new dwellings and a integrated land use and transportation planning. Underground space is already widely used for transportation, storage, extraction of heat and for foundations of buildings and infrastructure, due to the rapid growth of the city the underground use is expected to develop rapidly. The city of Oslo deals with geological challenges such as deep horizons of clay, often containing a large amount of organic matter, alum shale’s that contains enhanced levels of radium and uranium, and quick clays.
Read more about Oslo City in case study report TU1206-WG1-012
History
Although the oldest registered settlements in the region dates back to around 11000 BC, the city of Oslo was only founded around year 1000. The oldest part of the city was located in the eastern part of Bjørvika – at the foot of the green hill called Ekeberg. During the middle ages, the town developed into one of the most important centers of trade and commerce in Norway.
Oslo thrived until the disastrous fire of 1624, which reduced much of the city to ashes. The fire gave rise to the establishment of the new town at the opposite side of the Bjørvika bay, on the north side of Akershus castle and fortress[1]. The new town, named Christiania after King Christian IV of Denmark and Norway, was built on a grid plan in the typical European fashion. As a consequence of the great city fire, a ban on wooden houses was introduced in Christiania, allowing only solid brick, and half-timbered brick houses, a map over these can be seen in Figure 4. Still, many of the buildings had wooden cores, constructed in the traditional Norwegian manner using logs. At the time of the first official census in 1769, Christiania had 7469 inhabitants.
City facts
- Founded: Year 1000
- Size: 453,7 km2
- Urban area: 150 km2
- The approximately 300 km2 is the so called “Oslomarka” a forested recreational area protected against urban development by Norwegian law.
- Population 625 000
- Administration: The City Council has 59 members, headed by the Mayor of Oslo. Elections are held every four years.
Underground use:
- Railroad tunnels
- Metro tunnels
- Road tunnels
- Waste water tunnels
- Cables
- Foundations
- Storage
- Energy wells for heating and cooling
Underground challenges:
- Settling
- Deep clay horizons
- Deep clay horizons with high content of organic matter
- Quick clay
- Radioactive Alum shale
- Groundwater changes
- Rapid development of underground use
- No control of where or how deep new energy wells are drilled
ROTTERDAM
ROTTERDAM

Rotterdam is locatedin the wester part of the Netherlands in the province of Zuid-Holland. Most of the country’s surface is flat and cultivated, and present-day sedimentation and erosion are almost everywhere influenced by man: rivers are contained by dikes and many streams are canalized; swamps, lakes and large parts of an inland sea have been turned into polders; and in many places dikes strengthen the coastline. Without dikes nearly the whole western part of the country would be flooded. To keep the reclaimed polder areas dry and fit for farming, pumping stations – formerly windmills –extract water continuously for transfer into bordering water bodies.
Read more about Rotterdam City in case study report TU1206-WG1-013
Rotterdam is the second-largest city in the Netherlands and the second largest port in the world. Starting as a dam constructed in 1270 on the Rotte River, Rotterdam has grown into a major international commercial centre. Its strategic location at the Rhine-Meuse-Scheldt delta on the North Sea and at the heart of a massive rail, road, air and inland waterway distribution system extending throughout Europe is the reason that Rotterdam is often called the "Gateway to Europe".
After the successful period of post-world war II reconstruction Rotterdam continued enhancing its status as an international city. Its centre witnessed the appearance of the Erasmus Bridge and the Kop van Zuid, a former harbour area redeveloped into a residential area. Since then, the city has been boasting a skyline unique in the Netherlands. On the edges of the city large residential districts have been built. New entertainment venues, restaurants and festivals have turned Rotterdam into a place with a young, trendsetting image.
To keep playing a significant role in the international competition amongst urban regions, Rotterdam will have to employ a strategy that not only aims at the development of the knowledge and services economy but can also guarantee an appealing residential and social climate capable of attracting more graduates and creative workers.
The mission of the city council is formulated in the spatial development strategy 2030 and focusses on the following elements:
- Strong economy: Creating a strong economy concentrates on the transition from an industrial economy to a knowledge and services economy, based on the further development of the medical and creative sectors. In the port area. Besides the recently conluded construction of Maasvlakte 2, a large new port area, the emphasis will be on innovation in the fields of energy consumption and energy production as well as on the reduction of the emission of carbon dioxide.
- Attractive residential city with a balanced composition of the population: Good housing alone is not enough for an attractive residential city. High-standard public space is an important condition for creating attractive and popular residential environments,
The Rotterdam ClimateChange Adaptation Strategy has been developed with the aim of making Rotterdam climate proof by 2025. By climate proof we mean:
- by 2025 measures will have already been taken to ensure that every specific region is minimally disrupted by and maximally benefits from climate change both then and throughout the following decades
- structurally taking into account the long-term foreseeable climate change in all spatial development of Rotterdam, while allowing for any associated uncertainties
In concrete terms, this means, amongst other measures:
- Linking the strengthening of the flood defences to the urban specifications at the relevant locations. Dike reinforcements are seamlessly incorporated in the city and are multifunctional, serving, as recreational trails, natural embankments or are combined with area development. In the outer-dike areas, to seek clever combinations of protection (dikes), spatial planning (e.g. elevating some sections, floating buildings) and damage control (such as evacuation routes, water-resistant design of homes and external spaces, etc.).
- The ‘sponge function’ of the city is restored with measures which keep rainwater where it falls, store it and drain it away slowly. These include water squares which relieve the sewage system, infiltration zones along infrastructure and the integration of trees and greenery in outdoor areas (both public and private), which benefits the city environment. By frequently applying these small-scale measures to the ‘capillaries of the city’, we are able to reduce Rotterdam’s vulnerability and at the same time to add quality to the environment. This could include, for example, an underground water storage facility linked to car parks or blue-green networks in the city.
- Actively encourage heat resistance as part of the design, renovation and maintenance of buildings, outdoor spaces and the road and public utility infrastructure. This could be achieved by, for example, incorporating trees and greenery and creating shade and adequate insulation in homes and offices
- Maintaining the current robust system, such as dikes, canals and drains is and will remain the duty and responsibility of the government and local authorities (like the water boards). But climate change adaptation in the city requires more than this. The maintenance of many vital public utilities is in the hands of our urban partners. It is therefore essential that energy, the supply of (drinking) water and ICT networks do not break down for long periods of time and it is imperative that these remain robust in extreme weather conditions. Most of the buildings and land are private property. Implementing adaptation measures in both the public and private urban spaces therefore also requires cooperation with other parties.
- Climate change adaptation offers ample opportunities to strengthen the economy of the city and the port, to improve the quality of life in neighbourhoods and districts, to increase biodiversity in the city and to foster committed and active participation by Rotterdam residents in society. Working together for a climate proof city pays off!. Introducing more trees and plants into the city, for example, makes it less vulnerable to extreme rainfall, drought and heat stress. At the same time, this ‘green adaptation’ will make the living environment more attractive, become the motor for other investments and inspire the residents of Rotterdam to play an active role.
VALLETTA
VALLETTA

Photo by Zammit (2016)
Valletta is the capital city of Malta and serves as a governmental, a business and an administrative hub of the Maltese Islands. This fortified city is located between the Grand Harbour and Marsamxett Harbour. It includes numerous monuments and buildings which date back the 16th, 17th and 18th centuries and which make Valletta a UNESCO World Heritage site. Amongst various monuments, the city has an extensive network of spaces below its surface. Most of these underground spaces were developed throughout the years for military and defensive purposes. However, the subterranean of Valletta has not been fully explored and requires further research, documentation and exposure.
The City and its Needs
Valletta is full of activity during the day with various commuters visiting the city for commercial, employment and cultural purposes. On the contrary, the historical city is less frequented at night. The main reason behind this situation is attributed to the fact that the city core has been left in a derelict state for various years. In the past years, much effort has been done to revitalise the city and the Grand Harbour area. Works include the restoration of monuments that lie both above and below the surface, improvement of amenities for tourists and locals and opening up of bars and restaurants for entertainment purposes. However, there is still much work to be done, especially when considering that Valletta will be the European Capital of Culture in 2018.
Apart from the rehabilitation of the existing cultural heritage, transport has always been a major issue. In Malta, there is still high reliance on the use of private transport for commuting purposes. In the last decade, policies for Valletta have been geared in the promotion of public transport, reserving space for residents’ parking, reducing car space for non-residents and introducing pedestrianised spaces (MEPA, 2002). However, transportation must be assessed from a wider perspective by taking also into consideration the cities surrounding the harbours. In fact, currently, the government together with the private sector is also considering the possibility of excavating a ferry tunnel linking the Grand Harbour and Marsamxett Harbour. This would facilitate travelling from Cottonera to Sliema and encouraging the modal shift to public transport (Projects Malta, 2015). Safeguarding the existing heritage and the infrastructure beneath the city are major challenges for the proper completion of such project.
City facts
- Valletta covers a total area of 0.84 square kilometres.
- Valletta has 5700 inhabitants (2013).
- Population density is 6786 inhabitants per square kilometre (2013).
- The number of residents in Valletta has been declining and there are a lot of vacant buildings.
Read more in the City case study of Valletta in report TU1206-WG1-016
VIENNA
VIENNA
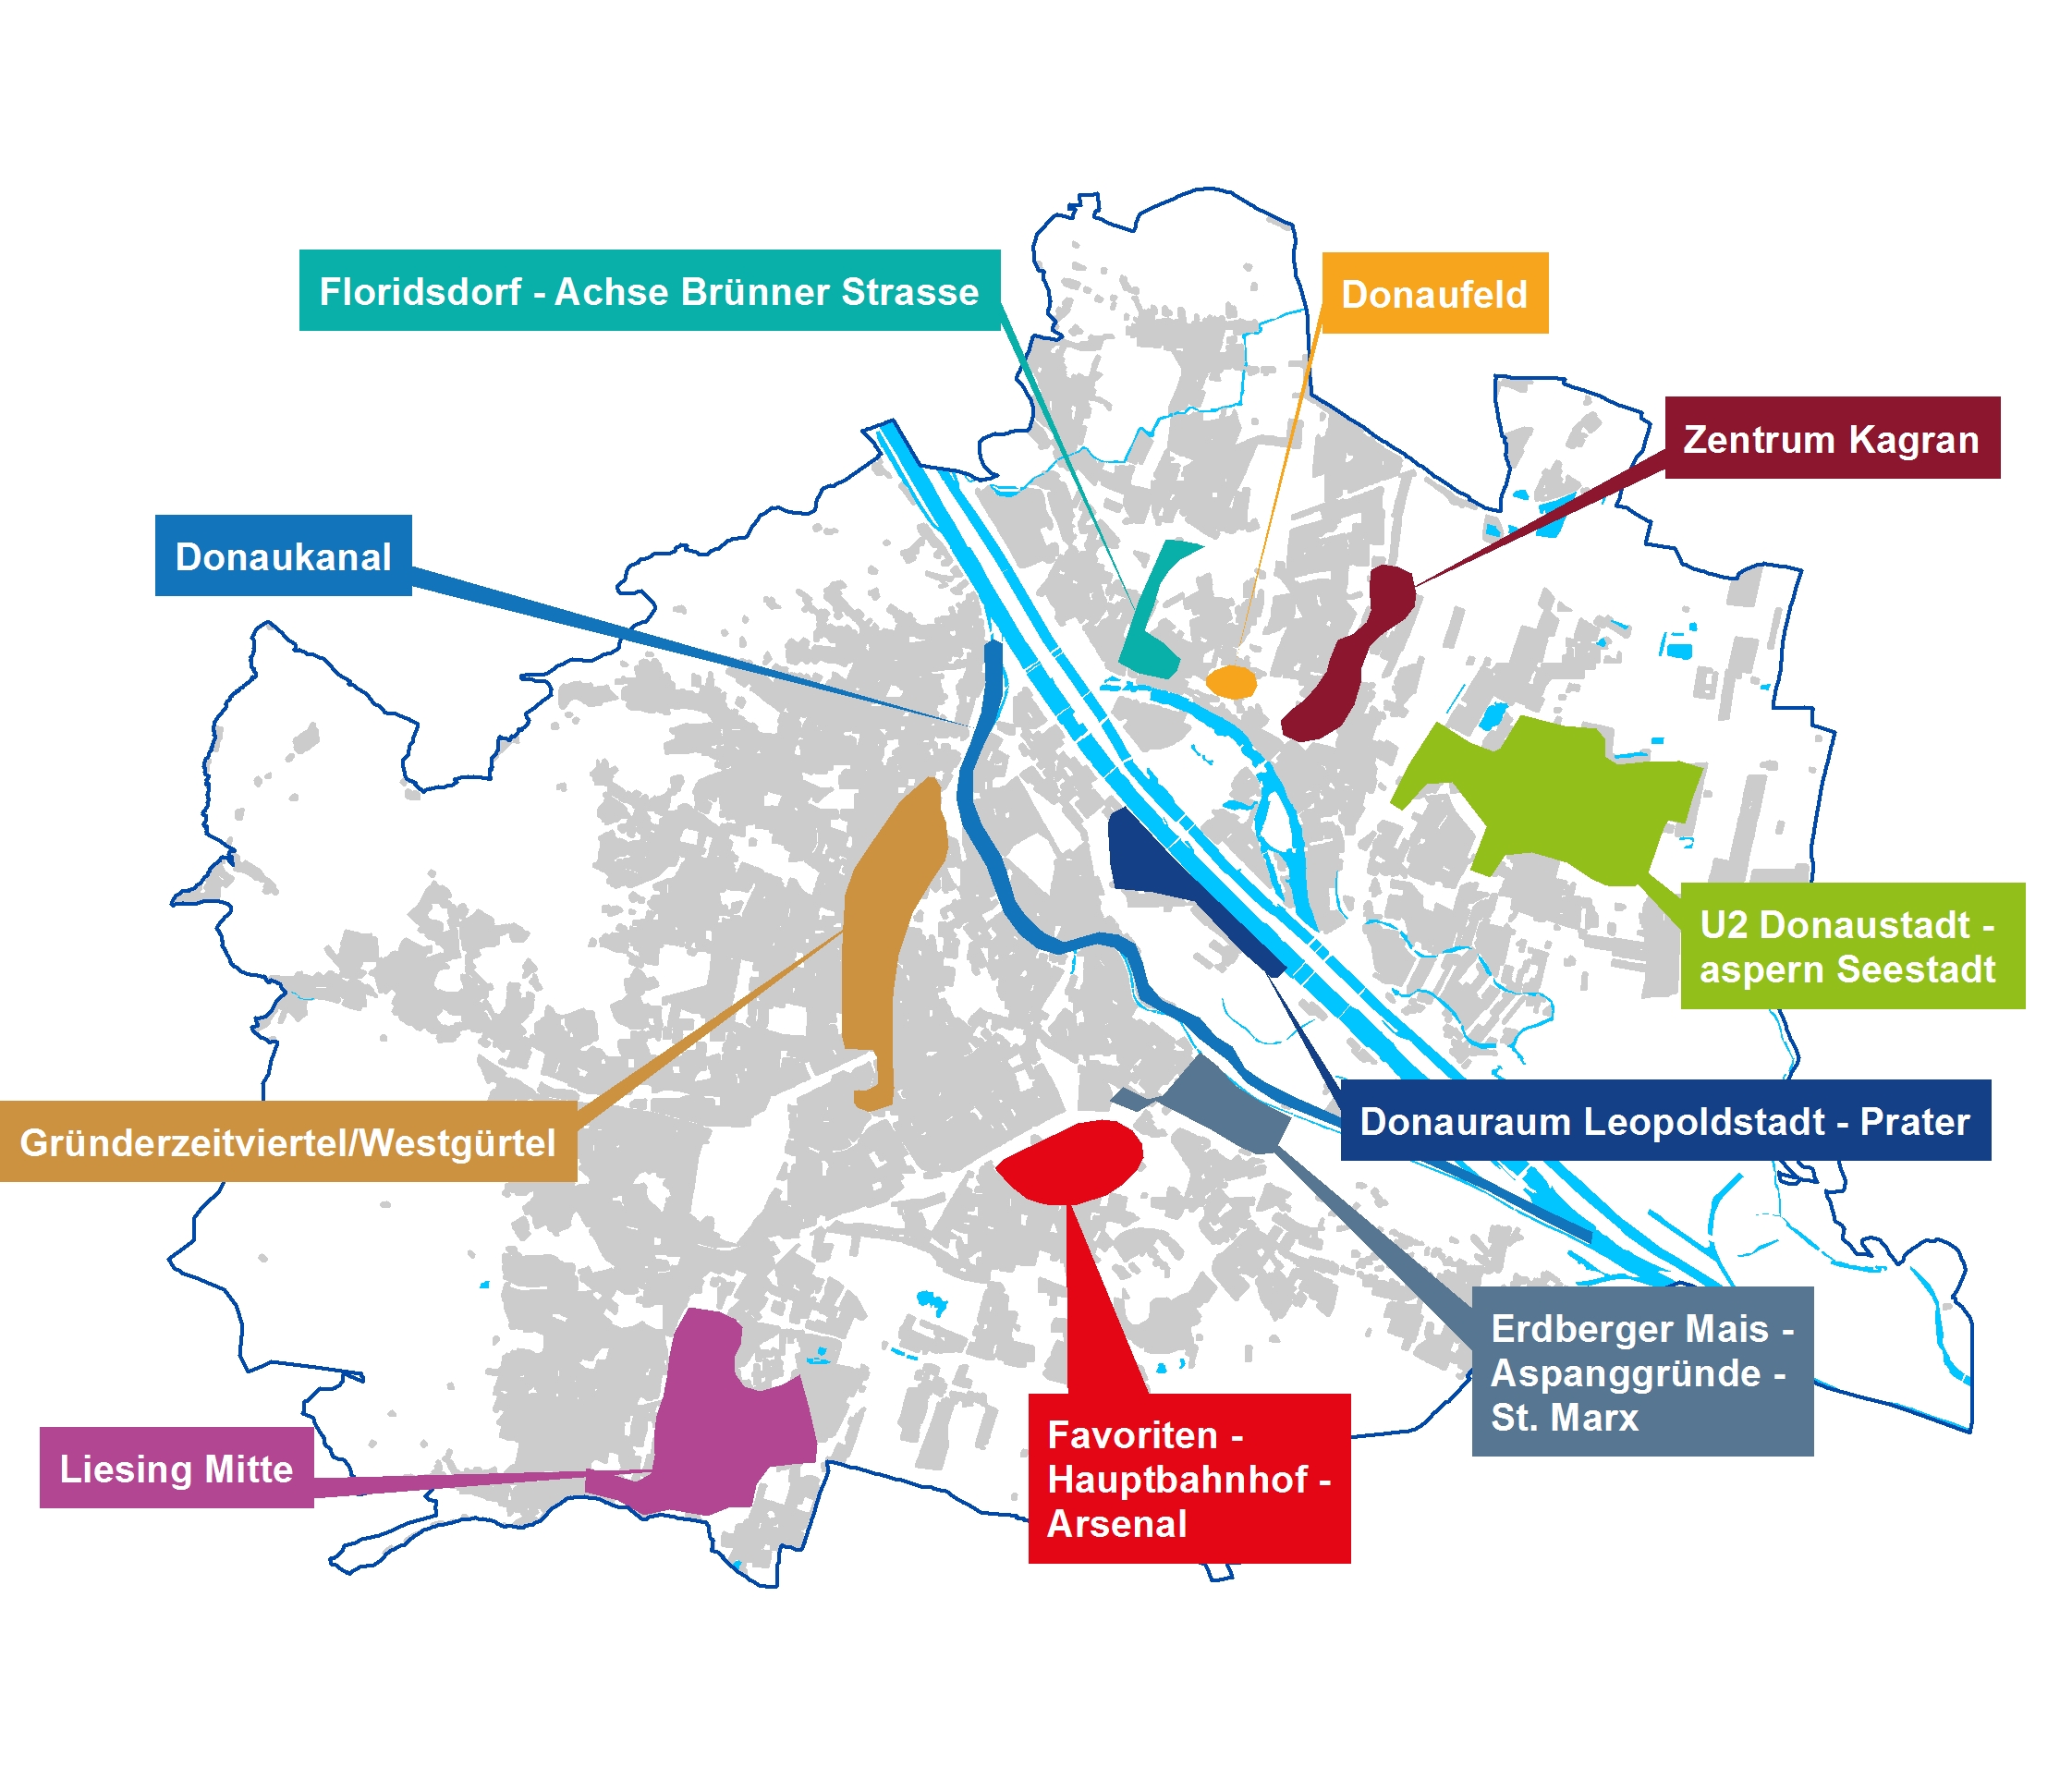
Target areas of Vienna urban development (2014)
Vienna is the capital of Austria and its cultural, economic and political centre. It is composed of 23 districts. Famous for its classical music, classicist and modern architecture, Art Nouveau buildings, imperial palaces, the State Opera, theatres, the traditional Viennese coffee houses and the Lipizzaner horses, Vienna attracts up to 6 million tourists per year. It is the home of over 100 museums and 13 universities as well as the seat of several United Nations offices (e.g. OSCE, OPEC, UNIDO and IAEA). According to the statistics of the International Congress and Convention Association, Vienna is the second most popular congress location worldwide, hosting up to 200 international conferences annually. Regarding life quality, the city was ranked as the second most liveable city worldwide in several 2015 surveys. As a global smart city, it reached third place among European cities in a 2014 ranking.
Vienna is located in the north-eastern part of Austria at the transition between the foothills of the Austrian Alps and the plane of the Vienna basin. The elevation ranges from 540 m asl in the West to 150 m asl in the Southeast. Flowing from North to Southeast, the river Danube crosses the central part of the city The city area covers approximately 400 km². The population currently amounts to 1,800,000 and is expected to rise to over 2,000,000 in the next few years.
Read more about Vienna City in case study report TU1206-WG1-014
History
Over 2000 years ago, the Romans established the fortified city of Vindobona on the river Danube as a military camp to protect their empire against Germanic tribes in the North. Since 1145, the city was the centre of the Babenberg dynasty, followed by the Habsburg dynasty in 1440, when Vienna became the capital of the Holy Roman Empire. During the Siege of Vienna in 1529 and the battle of Vienna in 1683, the city fended off the Ottoman armies advancing from the East. From 1804 onwards, Vienna was the capital of the Austrian empire and hosted the Vienna congress in 1814/1815. Drawing migrants from other parts of the empire and incorporating surrounding suburbs, the city’s population grew from 500,000 to 2,000,000 during the second half of the 19th century. It formed the capital of the Austro-Hungarian empire after 1867, and of the First Republic of Austria after World War I. Following World War II, Vienna was divided into four sectors and occupied by the Allied Forces until 1955.
Land use
The forests of the Vienna Woods cover the western city area, while the central and eastern parts are covered by housing estates, industrial areas and office buildings. The area of forests, parks, gardens and green spaces amounts to > 45% of total city area. At the northern and eastern city margins, the land is used for agriculture while industrial areas are situated in the North-east, South-east and South.